home
***
CD-ROM
|
disk
|
FTP
|
other
***
search
/
Developer Source 8
/
developer source - volume 8.iso
/
sdevl
/
jul96
/
jonef104.gif
< prev
Tile
Graphics Interchange Format
|
1997-01-16
|
32.2 KB
|
424x228
|
4-bit (16 colors)
ocr:
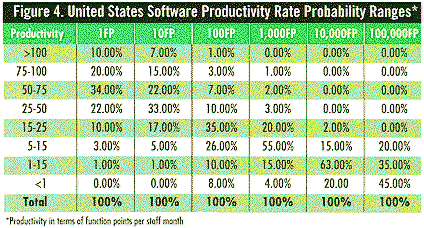
Figure 4.1 United States Software Productivity Rate Probahility Ranges* Productivity IFP TOFP 100EP 1,000EP 10,000FP 100,000FP >100 10.00% 7.00% 1.00% 0.00% 0.00% 0.00% 75-100 20.00% 15.00% 3.00% 1.00% 0.00% 0.00% 50-75 34.00% 22.00% 7.00% 2.00% 0.00% 0.00% 25-50 22.00% 33.00% 10.00% 3.00% 0.00% 0.00% 15-25 10.00% 17.00% 35.00% 20.00% 2.00% 0.00% 5-15 3.00% 5.00% 26.00% 55.00% 15.00% 20.00% 1-15 1.00% 1.00% 10.00% 15.00% 03.0070 35.00% <l 0.00% 0.00% 8.00% 4.00% 20.00 45.00% Total 100% 100% 100% 100% 100% 100% Productnity int lems cil fusxtion points per slaff: month